Users' Diaries
Recent diary entries
Posted by renminbo on 14 January 2023 in German (Deutsch).
Der “gute Wanderweg” ist ja fast immer ein Pfad, Tracks sind nicht so beliebt und dürfen auch bei Premiumwegen nicht zu oft vorkommen. Und bei Pfaden fehlen mir oft: Ein Tag, dass die Attraktivität einstuft, unabhängig von den schon vorhandenen Tags (s.u.). Da könnten eingehen: schöne Aussicht, Schatten im Sommer, etwas Licht im Winter, interessante Wegführung, Nähe zum rauschenden Bach. Wie man so etwas definieren könnte, ist nachzulesen auf den Seiten der Weg-Zertifizierer (also Wander-Institut etc.).
Wir haben ja eigentlich schon eine ganze Menge an Tags, die die Attraktivität beschreiben können: die Breite, die glatte Wegoberfläche und die Sichtbarkeit (Visibility). Hier scheint mir der Haken zu sein, dass die meisten Renderer diese Tags gar nicht auswerten. Und wozu trägt man Tags ein, wenn sie in den Karten nicht auftauchen? Änderungen am Rendern könnte also helfen.
Trotzdem meine ich, dass es für Apps wie Komoot nicht einfach ist, einen “schönen” Wanderweg per Autorouter zu erzeugen. Und die Zukunft der Wanderkarte liegt ja irgendwo bei diesen Apps.
Ich würde mir ein neues Tag für Premium-Eigenschaften wünschen, das widerspiegelt, ob ein Pfad von einem normalen Wanderer als “Traumpfad” oder als “langweilig und öde” eingestuft wird - also eine Art von Grade 1 - Grade 5.
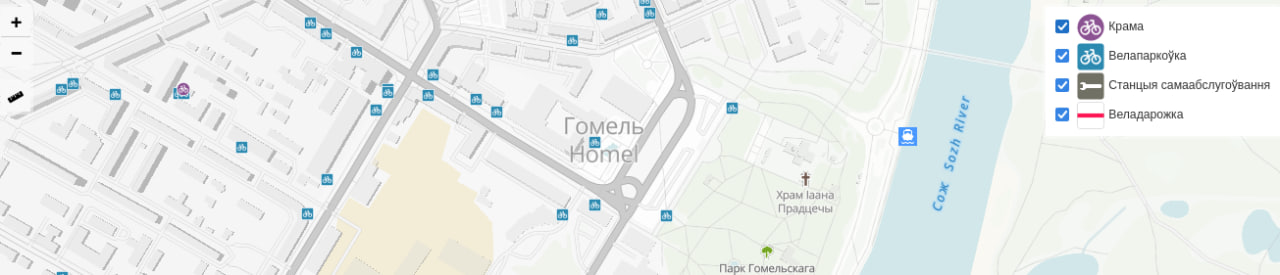
At the end of 2021, I had an idea to collect missing bicycle infrastructure data in Homieĺ (Bielaruś), then visualize and generate statistics. Thus began a project called Bicycle Homiel.
Projects Stages
- Collecting and adding missing data to OpenStreetMap: both missing objects and characteristics of objects
- Export data into a PostgreSQL database
- Calculation of general statistics with SQL, calculation of statistics by districts with PostGIS
- Export geodata into GeoJSON; export statistics into JSON
- Uploading geodata and statistics to the website
Point objects (parking, shop, repair station) were collected using Every Door. Cycleways were photographed, and then missing data were added using JOSM.
And while cycleways were generally fine, most of the shops, parking lots, and repair station were missing in OSM.
Statistics
As of 13.01.2023 OpenStreetMap has 629 bicycle parking, 17 km of cycleways, 14 bicycle shops, and 4 bicycle repair stations in Homieĺ.
Posted by bkil on 13 January 2023 in Hungarian (Magyar).
Részletek / details: https://wiki.osm.org/Hungary/20230116

Hi all ! I want to share the information about that I have created two OpenStreetMap Bot on Twitter
- Open Street Map Retweet Bot
https://twitter.com/OSM_retweet_bot
This Bot is created to follow the recent trends on OSM, What people are thinking or doing in OSM, This bot will try to retweet the tweets with hashtags : #osm, #openstreetmap and #hotosm, Runs every three hour
- Open Street Map Stats Bot
This Bot is an implementation of standalone open source tool called OSMSG https://github.com/kshitijrajsharma/OSMSG, This tool uses osmium to analyze the change files from OSM using different URLs and generates the stats in different file formats such as CSV, JSON, image etc. It has a GitHub action enabled which will run the stats for requested region and global and produces the stats in CSV and image format and shares it with the twitter community, You can follow the GitHub tool itself to see / download the stats. I have added Nepal as monitoring country, but if you want any other countries, you can request it via opening an issue or mentioning bot to twitter. https://github.com/kshitijrajsharma/OSMSG/tree/master/stats Since it uses GitHub, you can also go through the historical stats using GitHub history it will keep updating the same file when it runs and shares the link in twitter
Both projects are open source and beta release, I will be looking for the recommendations and improvements on future ! Thank you !
- Saving lives on water
- Providing data to map dangerous water body areas
- Improving the safety of sails on water bodies
Posted by Chiquinho gavião on 11 January 2023 in Brazilian Portuguese (Português do Brasil).
É minha primeira publicação no diário do OSM, espero poder contribuir com a comunidade e entender melhor as funcionalidades do OSM.
Posted by OMNIBUS on 11 January 2023 in Spanish (Español).

Best regards Johan,
Recently we have opened the project Ciénaga Grande del Bajo Sinú, Córdoba, Colombia.
Despite I have been mapping in this area since 2017, as a colaborator of Water telling stories Social Movement “Movimiento Social el Agua Contando Historias”, I haven´t called other mappers to help us.
We need a lot of support to better mapping such an ecosystem like this. We are planning also write to HOT OSM HUB Latam to propose our project to be accompained by them.
I want to invite all mappers interested to join the task of mapping the swamp.
Here is the link to the wiki, the task and telegram coordination group. If you have any questions I will be attentive, soon we will convene spaces of exchange on this area with the OSM community.
- https://tasks.hotosm.org/projects/13935
- osm.wiki/Colombia/Project-Cienaga-Grande-Bajo-Sinu
- https://t.me/redhumus
Thank you
I was going to do some more field name surveying next week, but shock, horror, it is no longer possible to “make an atlas” on fieldpapers.org.

DeBigC and I have tried to find out why. There was a post on GitHub, even before I noticed it, but no reply. DeBigC was more successful on Reddit, where the reason is given as having run out of funding.
This really is a shame; it was such a useful tool. Maybe there is a way to bring it back?
EDIT 11-01-2023 21:41: It’s back working again, very strange.

Dear all,
Today, v5.7.0 of the OpenStreetMap Carto stylesheet (the default stylesheet on the OSM website) has been released. Once changes are deployed on openstreetmap.org it will take couple of days before all tiles show the new rendering.
Changes include - Unpaved roads are now indicated on the map (#3399)
-
Country label placement improved, particularly for countries in the north (#4616)
-
Added elevation to wilderness huts (#4648)
-
New index for low-zoom performance (#4617)
-
Added a script to switch between script variations for CJK languages (#4707)
-
Ordering fixes for piers (#4703)
-
Numerous CI improvements
Thanks to all the contributors for this release, including wyskoj, tjur0, depth221, SlowMo24, altilunium, and cklein05, all new contributors.
For a full list of commits, see https://github.com/gravitystorm/openstreetmap-carto/compare/v5.6.2…v5.7.0
As always, we welcome any bug reports at https://github.com/gravitystorm/openstreetmap-carto/issues
Posted by Paulo Rogério Albuquerque de Oliveira on 10 January 2023 in Brazilian Portuguese (Português do Brasil).
Eu e Zaila 9 a 11 Jan 23
Posted by Oleg Kholin on 10 January 2023 in Russian (Русский).
Похож на Openstreetmap, но контуры зданий и их положение отличается. Видимо использовали другие космоснимки для прорисовки. Особенно накопать про наполнение карт не удалось. Может кто-то поможет? Чисто ради интереса.
Posted by ZeLonewolf on 10 January 2023 in English.
Last updated on 11 January 2023.

The Americana vector style uses OpenMapTiles as its backing data schema. When the project desires to add a new feature that isn’t available in OpenMapTiles, someone from the team typically submits a PR to add it. Eventually, OpenMapTiles will create a release, which gets picked up by the Planetiler OpenMapTiles profile, after which I would re-render the planet on an AWS instance. This process from end-to-end often takes months before we see the results at planet scale.
Because planetiler’s update cycle follows OpenMapTiles, contributors need to use the older openmaptiles-tools, which can take days, weeks, or even months to render a planet, depending on how powerful the developer’s computer is.
Therefore, when testing a change to OpenMapTiles, a contributor would typically test their changes on a small area, with a command like:
./quickstart.sh rhode-island
This command would download a PBF extract from Geofabrik, and run a series of scripts that ultimately produce an .mbtiles file of Rhode Island. If you’re testing a feature that appears at high zoom, you can edit .env and change the setting to render down to the maximum zoom of 14. Because Rhode Island is so small, a full-depth render only takes a few minutes.
However, what if you are testing a low zoom feature like an ocean or sea label? If you need to test whether the Atlantic Ocean label is rendering properly, there is no extract short of the planet that will contain an ocean.
The solution for developers working with these features is to download the planet file, and then pre-filter it using the tags-filter feature in osmium tool for just the features that you care about testing at low zoom, and then render that into tiles.
First, you download the planet pbf file:
AREA=planet make download
This will download a file planet.osm.pbf into the data/ folder.
Posted by Pieter Vander Vennet on 10 January 2023 in English.
Last updated on 18 January 2023.

What licenses are used?
Now that MapComplete is two-and-a-half year old, it’s a good time to see what license people are using to upload their images.
Why do I care?
The first reason to do this research is curiosity. How much pictures are uploaded with what license?
The second reason is a very practical and UX-driven: if a significant portion of contributors doesn’t bother to change the license, then the license picker can be moved from the ‘infobox’ into the ‘user settings’, freeing up valuable space there. User tests have pointed out that this is valuable.
Methodology
MapComplete uploads images to imgur.com and then links to this image using image=https://i.imgur.com/aBcDeF123.jpg.
Some metadata (most notably the author and chosen license) is added as ‘description’ to the image on Imgur.
If multiple images are added, then keys image:0, image:1, image:2… is used.
At last, themes can also add images under a specific key. For now, only the etymology-map does this with image:streetsign.
Overpass was used to download all features with a tag matching one of the described keys and matching an imgur-url.
Then, the description of all those images is downloaded and parsed, yielding the needed metadata.
Even though some people did add images to imgur to link them to OpenStreetMap before, we assume that (nearly) no images will also have the license information encoded as MapComplete does. Furthermore, this does not keep images of now-deleted features into account, nor does it take images into account that have been deleted in the mean time. I don’t think it’ll make a big difference though.
The resulting datasets are here. The script to download this all is in the MapComplete repository. Keep in mind that using this script will exhaust the daily IMGUR rate limit; so please use a different access token or spread the download over two days as was done for this research.
Results
Edit: When I tried to add this, the MapComplete account got caught in the spam-filter (rightfully so), so I published the report on my personal user diary.
To keep the discussion in one place, I’m removing the entry here

Most of my mapping is done via “armchair mapping”, using aerial imagery to add buildings and features around. I’m thankful that where I live, I have high quality, and relatively recent aerial imagery. Because most of what I map tends to be residential (since in order for the map to be useful to people, they want to know that where they live is actually present), I find that I add a significant number of houses, garages, and sidewalks/footpaths. When available, there are open data sources for addresses, so I’ve found that adding data in stages seems to help.
The first stage being correcting roads that haven’t been touched since the Tiger imports, fixing and adding land use such as residential or retail or farm areas, adding paths and other routing features.
The second stage I add buildings such as houses, retail, and whatnot, fix imported church and post office/official building locations based off internet search addresses and educated guesses (e.g. does the building look like a church or have white vehicles nearby? Then it’s probably the nearby labeled church or post office, etc. Also does searching for {town name} and eg “baptist church” etc yield usable results like a website? Sometimes not, but most often yes).
In addition to buildings, I like to add power poles, fire hydrants, and other service things like benches, street lamps, etc if they’re present and I can see them on the aerial imagery (or can assume they’re there from wire locations and other context clues).
In 2020, the Queensland Government Department of Natural Resources, Mines and Energy (DNRME) made a statement in regard to the CC:BY 4.0 datasets made available through their Queensland Spatial Catalogue (including their Digital Cadastral Database (DCDB)).
Nemanja Bracko posted the statement at https://github.com/microsoft/Open-Maps/issues/49
Can I highlight this passage from DNRME’s statement:
“data accessible from the Queensland Spatial Data Catalogue […] licensed under the […] CC:BY 4.0 licence […] permits OpenStreetMap to copy and redistribute the data, and remix, transform and build upon the data for any purpose”
This statement is expressing DNRME’s intent in respect of their CC BY 4.0 data. It essentially functions as the “explicit permission for use in OpenStreetMap from licensors of CC BY databases and data” contemplated in https://blog.openstreetmap.org/2017/03/17/use-of-cc-by-data/
Additionally, section 2.a.5.B of CC:BY 4.0 contemplates “Technological Effective Measures”, but the DNRME’s view is that Technological Effective Measures are no matter: DNRME also permits its CC:BY 4.0 data for any purpose.
Thank you, Nemanja, for making the enquiry and posting the DNRME’s response.
 Lord’s Rake: one of the steepest paths marked on OSM in Upper Wasdale
In my last diary I introduced the idea of using elevation models (DEMs), specifically a DTM (terrain model) to find sections of hiking paths on OpenStreetMap which may cause problems for regular hikers. In this sequel I describe a refined approach using a higher quality terrain model and a vertex-based approach to calculating slope angles actually likely to be experienced by walkers.

 Punto limpio de proximidad (minipunto limpio) de la empresa de limpieza municipal del Ayuntamiento de Málaga en la plaza John Fitzgerald Kennedy. Fuente: trabajo propio (CC BY-SA 4.0) disponible en Wikimedia Commons.
Como comentaba hace algunos meses, el Ayuntamiento de Málaga tenía previsto instalar 14 minipuntos limpios para reciclaje distribuidos por los once distritos de la ciudad. Ya están disponibles estos minipuntos limpios, denominados ahora puntos limpios de proximidad. La empresa municipal de limpieza, Limpieza de Málaga SAM, los ha instalado esta mañana y el Ayuntamiento lo ha anunciado a través de una nota informativa (702.8 KB).
En estos puntos limpios se podrán reciclar pequeños electrodomésticos, pilas, cápsulas de café, lámparas de bajo consumo, aceite, tóneres, libros y revistas, tapones, radiografías, cintas de vídeo, discos compactos (CD), tubos fluorescentes, aceite y aerosoles.
Posted by Zainab Ramadhanis on 9 January 2023 in English.
Last updated on 20 June 2023.

November 2022 was such a pleasant moment because I participated in the State of the Map Asia for the first time. I always wanted to join the SotM in person since 2020 after participating in lightning talk SotM 2020. In 2021, I didn’t have chance to submit my research result because I just finished it on early July. So, I proposed myself as a translation volunteer for Bahasa Indonesia (see SotM 2021).
In 2022, I also planned to join SotM 2022. However, I couldn’t join because I was very busy with my thesis and had to graduate before September 2022. I thought I didn’t have a chance to join any OSM event in 2022 before my friend sent me an Instagram post that Open Mapping Hub Asia-Pacific was looking for scholars. There were three categories of scholars: community nomination, mapping, and map-making poster. I decided to submit in map-making poster category because I didn’t participate at all in OSM local community in Indonesia since I lived in Taiwan to study, and I didn’t contribute much to OSM in 2022. I created the map-making poster about the quality of road data OSM in Jakarta by comparing the OSM data and local government data (see my poster here). Thank you Open Mapping Hub Asia-Pacific for this amazing chance!
I arrived in Legazpi City, Philippines on Sunday, November 19, 2022. Mayon Volcano became the first thing that I saw when I landed at Legazpi Airport. The scenery of Mayon Volcano was very beautiful, I didn’t take a proper picture at that moment, but I took a good one when I visited the Cagsawa Ruins on Tuesday (11/22).
State of the Map Asia 2022 was actually different than any SotM Asia events before, as it collaborated with Pista ng Mapa (Festival of Maps), so the conference was quite long, five days in total. But I didn’t complain, because all the presentations and workshops were totally fun!