
Adding thousands of roof:colour tags for fun and not really for profit
Posted by PizzaTreeIsland on 15 December 2025 in English.Recently, I started adding a large number of roof:colour tags to buildings that had previously lacked this information. I started in Colorado Springs for no particular reason, but I plan to expand this activity further. For reasons I will explain later, starting and then continuing with American suburbia is easier than mapping other regions, but in theory, my approach would work world wide. For this mapping activity, I developed my own processes along with some little software helpers, that people on the OSM World Discord were interested in when I mentioned them. So without further ado, here is everything you need to know about my roof colour related activities.
Motivation
So why am I doing this to myself? The most honest answer would probably be “more data, more better”, which is mostly why I do any of the things I do on OSM, but there are two more concrete possible applications for the data I add: Art and science.
I am interested in artistic maps and realistic depictions of places. This is also why I wrote a python library that helps you make a best guess about street width data on streets that either lack this information or have it in a non standard format. (Please do not use this to feed street width data back into OSM, the results are only guesses that might be just good enough for rendering an artistic map).
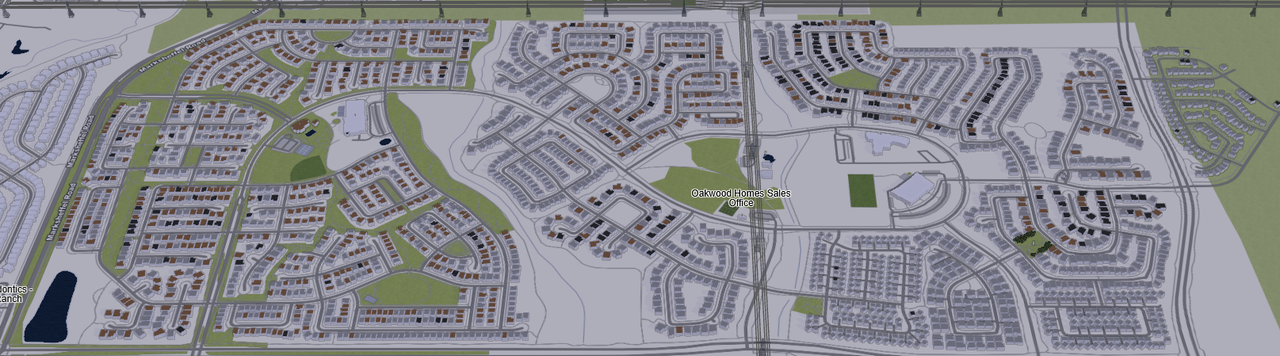
The scientific use for the data is a bit more vague, but mainly because I don’t know a lot about that. It’s mostly something I realized while adding the roof:colour data and thinking “hm, interesting”. In newly built areas, houses will often have the very same roof colour per area, while older neighborhoods tend do have evenly mixed roof colours. Exceptions exist, I found a number of neighborhoods with the same shade of grey roofs, where 3 of them are suddenly brown or black. My guess is that these houses were sold before they were built and the new owners got a say in details like roof colours. Those exceptions to the rule also tend to be close together at one side of the neighborhood, further supporting this idea and implying a build-direction. Lacking other data, this might help when researching urban sprawl developement patterns. It might also very well not help. I just add my roof:colour tags.
Of course there are countless other possible uses for this data, most of which I can’t even imagine right now, which is the beauty of OSM or of open data in general.
Used values and why I don’t like hex codes in OSM colour tags
I chose to use colour vales like grey, red, black, brown, white, green and blue. These are among the most common values for roof:colour tags and I find it important to have standard values whenever possible. Here is a short list of colour values that are also very popular and why I decided against using them:
gray
roof:colour=gray exists over 118 000 times as the 5th most common value for this tag on OSM, and I don’t know exactly why. There is a widely complied with consensus to use british english spelling, and if I added thousands of roof:color tags, it would quickly be fixed.
lightsalmon
There are a number of these more obscure colour values, most of which seem to come from HTML colour values. These are a great invention for what they were intended to, giving a both human- and machine-readable set of defined values for desigining simple computer graphics. However, both in the name of standard values and in accordance with one of OSMs most core principles, I decided against using them: First, standard values. If I see a house with a brown roof, or I want to query overpass for brown roofs, I automatically use roof:colour=brown. Of course I can query for a whole list of shades of brown, including Charcoal, Oil, Black Cat, Black Eel, Black Cow, Gray Wolf, Vampire Gray, Gray Dolphin and Coffee, but I bet most people wouldn’t think of it, and it is also very tedious. Fewer, more common colour names might be less accurate, but in the end more useful and searchable. The other reason I decided not to use those more detailed colour values is the principle of ground truth and verifiability. There is no way to objectively tell if a roof is Jade or Earth Green just by looking at it. But it will always definitely be green. Which brings me to the final kind of colour value I don’t like using:
#978880
There are countless buildings that have some sort of hex value as their (roof) colour. In my opinion, there are several issues with this: - There is no way to tell what colour this is, just from looking at the value. Some people learn it and there are wordle-style games to practice, and it is a cool party trick, but for most people, especially those who are not designers, this is not human readable. - Standard values. While there are 140 supported HTML colour values, the 6 digit hex codes can have 16 777 216 different values. It makes no sense to sort the almost 670 million buildings on OSM into this many categories. - Verifiability. As I argued before, there is no way to tell if a roof is Jade or Earth Green. With the much more granular distinguation of hex colour codes, this becomes even more of an issue. In addition, using such a measurable value implies some sort of objectivity that is impossible to archieve with normal mapping processes. The light or moisture of the roof, as well as dust or a thin cover of moss will change this value drastically, and different aerial or street level imagery will have vastly different colour values. So in addition of it not making sense to have this detailed of a colour value, it is not even possible when using classic mapping techniques and the usual available imagery. It reminds me of the time when I looked at width tags when working on the aforementioned python library and found a doorway width that had so many significant digits, it was accurate to the width of a hydrogen atom. Impressive if true, but almost definitely not true.
By the way, the colour value #978880 I used as an example is a very light shade of brown. Ironically, the building itself has a very simple colour=white tag.
My process and tools
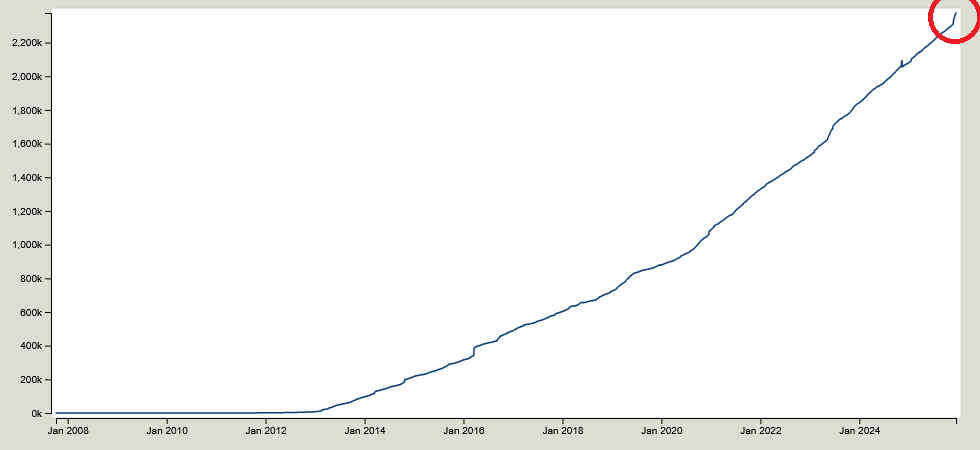
The usual process for adding roof colour data would be zooming in on the desired area in your editor, looking at a specific building to determine its colour, and then typing the value into the corresponding text field, depending on which editor you’re using, before scrolling on to the next building. The possibility of typos aside, this is a lot of clickwork for what is essentially only one, often very simple decision, which is why adding roof colours is usually so tedious. It just doesn’t scale. Therefore, I built my own tools in an effort to streamline this process without giving up any quality. My process begins with querying the overpass api for buildings that don’t already have a roof:colour tag. I later also excluded objects tagged as building=no or building=greenhouse. I find that several hundered buildings are a good change set size for me and my process. Then, I download the aerial imagery and let my custom script chop up the imagery based on the building polygon locations from the OSM data. Then begins the sorting. Because the gui tool I built for this process is purpose built, and because there are so few value buckets I sort the roofs into (see aforementioned explaination on colour values), it is quite streamlined. I experimented with several tinder-like designs where I swipe each roof into several directions. It is important to note that here is always also an option for not adding any value, either because I can’t decide on a value, it is more difficult because, for example, a roof has several parts with several distinct colours, the building is under construction, or I can’t see the roof colour, for example because of trees covering the area. This already sped up the process significantly, but it was still somewhat tedious. Therefore, I found a way to let ✨AI✨ help me without giving up controll over the final colour decisions. I already know what you’re thinking, but hear me out: What most people think of when they hear AI since the launch of ChatGPT are LLMs, which are an impactful technology but have nothing at all to do with what I am doing here. The sort of “"”AI””” I am using is a neural network. These are much simpler, explainable, their results are reproducible and, most importantly, the way I implement them, they don’t have the final say in the data I am going to upload. More on that later. Neural networks have a number of inputs, perform mathematical operations on them and produce a number of outputs. They are most commonly used to categorize data. One famous example is recognizing hand written digits: The inputs are the pixels of a black and white image of the hand written digit, each of which can either be a 1 (black) or a 0 (white). The outputs are 10 different values, each corresponding to one of the digits from 0 to 9. These output values are the likelyhoods that the input image shows the respective digit. I made my own neural network that takes the histogram data, so basically the distribution of what colour appears how often in each roof image, and outputs similar likelyhood levels, corresponding to each of several possible roof colours. To train this network, which is to say to adjust the countless values of the mathematical operations that lead to each combination of input values having the correct corresponding level of outputs, you need labeled training data. Luckily, there are already about 2 million roof colours tagged. I downloaded a few hundered thousand buildings aerial imagery and cropped them as decribed before, in order to train the network. This has the advantage that solar panels, trees reaching over the roof, surface impurities, chimneys and other roof details as well as imagery specific colour balancing are already taken into account.
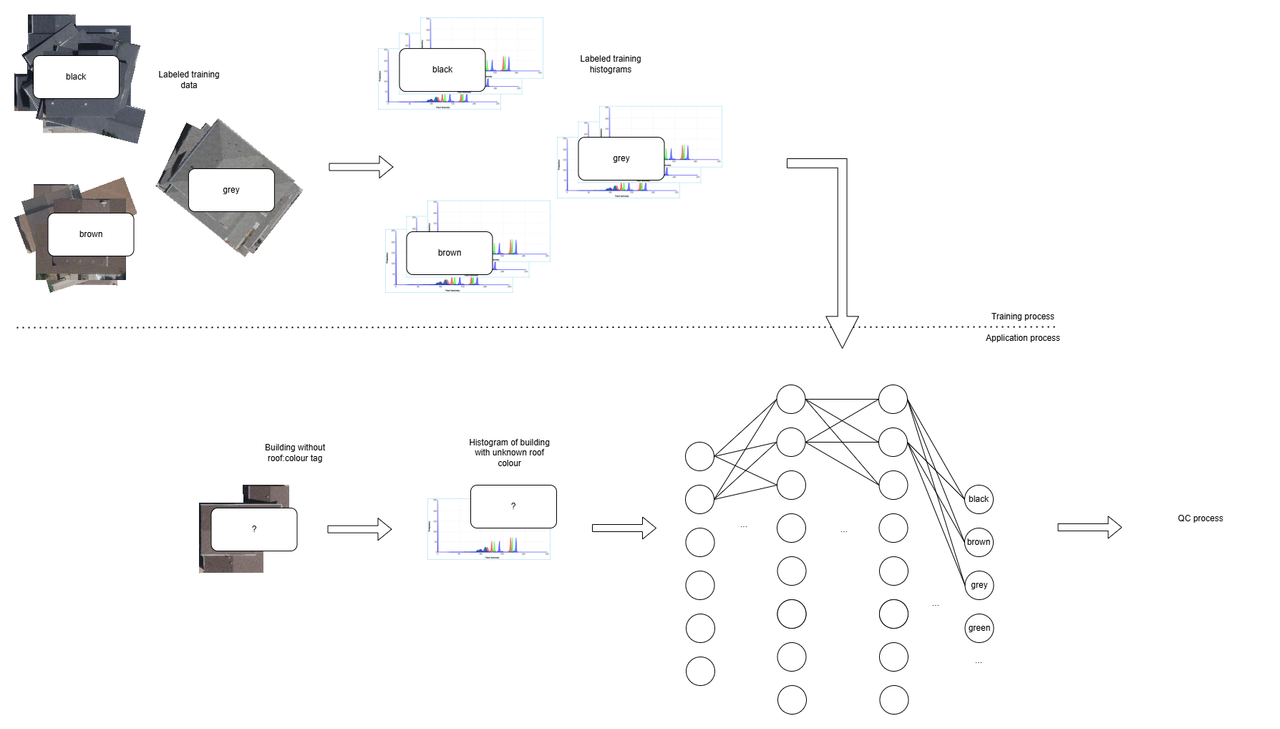
I then, and I feel like this is the point you’re anxiously waiting for as you’re reading this, wrote a GUI tool that displays the results of the “AI” categorization for me to check and adjust if necessary. I scroll through the list and either move roofs around to other colours, or remove them entirely if I can’t make a decision I feel good with. I make a point of looking at every single image, even if there are hunderets. There is an argument to be made about a computers authority bias, as well as it being far easier to just quickly scroll through and accept the results rather than manually doing a lot of changes, which is the biggest reason why I don’t publish my tools for others to adopt this workflow. I worked on the model myself so I know of its shortcomings, and I put my own reputation as a member of the OSM community on the line, which is why I make a point of checking extra thoroughly if the data I am uploading to OSM has a quality I can be proud of.
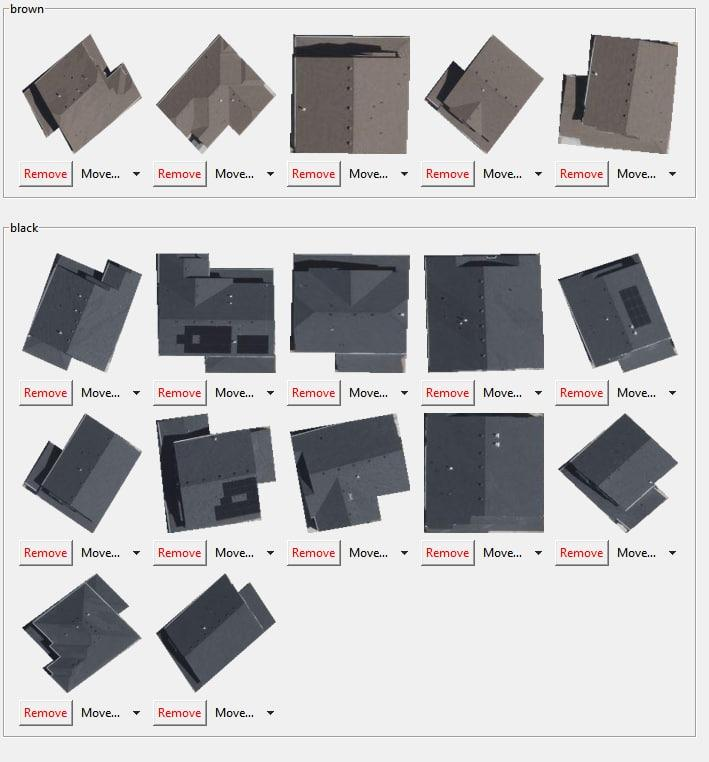
During these QC processes, I quickly learned that the model I trained was good, but not perfect. Especially the difference between grey and black, which is mostly easily recognizable in tar paper roofs by hand, was often wrong. I blamed the training data being inconsistent, as well es from all over the world, including different building styles and imagery parameters. I then downloaded the tens of thousands of houses in Colorado Springs I had already categorized before, with tedious adjustments in my QC GUI, and used them to train a new, more specified model for suburban houses in the American mid-west. For now, there are more than enough buildings that fit this description waiting for their own roof:colour tag, but if I wanted to expand this activity to other places of the world, that would probably require a lot more manual sorting before I can then train an other region specific model for that region. After my quality controll step is done, the roof:colour tags are automatically written into the geojson file, which I then upload to OSM by merging the features inside JOSM. I use JOSM to upload the data both because I did’nt want to deal with OSMs editor api, and because using JOSM gives me one more step of quality controll, being able to see the buildings with their tags and the list of changes that were made before uploading.
Since I am the only person to use my tools and I made them to contribute to OSM, and not to get stuck in yet an other feature creep hell, I consider the developement of my process to be finished, although I do keep a wishlist of features and minor tweaks in case I do continue improving it. It includes:
-
Minor cosmetic and quality of life tweaks in the UI
-
Automating the process of training and re-training region-specific networks as I continue to add more roof colour data to each region
-
Solution for oblique imagery, especially with tall buildings, where the building footprint and the roof area differ significantly. I haven’t looked into it, but maybe there is a way to obtain some sort of height angle error map that, along with the building height information, can be used to calculate an offset for the cropping function
Discussion
Comment from Lumikeiju on 15 December 2025 at 19:42
Thank you so much for sharing this great write-up! I really appreciate it.
Comment from Koreller on 15 December 2025 at 23:16
It’s great to understand the process and the technique behind a “simple” addition of colour. Thank you for sharing!
Comment from theorangetheme on 16 December 2025 at 00:53
This was a joy to read, thank you. Nicely done! I love “more data, more better”, too. You never know when something will help someone, but if it’s in there, then it’s in there for whomever comes along in the future.
Comment from Lumikeiju on 16 December 2025 at 01:03
Thinking up possible uses of seemingly-frivolous data is always fun.
There’s the obvious ones like “better renders” but, to use roof colors as an example, maybe some researcher in the future wants to evaluate something like the relationship between energy costs and roof colors, to see how much of an impact darker/lighter roofs have on heating and cooling costs and, based on the climate of an area, what range of colors is ideal. Who knows?
Comment from theorangetheme on 16 December 2025 at 01:33
Oh yeah, my first thought was albedo. You overlay reflectivity satellite imagery on top of OSM with roof colors, and I bet you can learn some interesting stuff.