
tl;dr I created Maxspeed freshness tool where you can see if maxspeed tag exists, and if it does - how old it is!

Why this tool
This tool emerged from a need within the local community. In Serbia, we have more street-level cameras and volunteers capturing road data than ever before! We even have people actively editing data based on those captures (which are not necessarily same people😀). Good problems to have! The big question is: Where should we capture images next?
We needed a comprehensive view of highways missing maxspeed tags so that people could go there. Additionally, we noticed some major motorways had outdated information—some maxspeed tags hadn’t been updated in over a decade. Everything gets old, even maxspeed tags.
I created first version of this tool (for Serbia only) and response was really good. This map revealed stuff that would not be otherwise visible and gave us great insight in quality of data on local roads! We discussed styling of the map, and how to do filtering better. I got lot of good input and after some iterations, we settled on final design. I wanted to see if this can be useful to other people, so here we are – with a map of whole world.
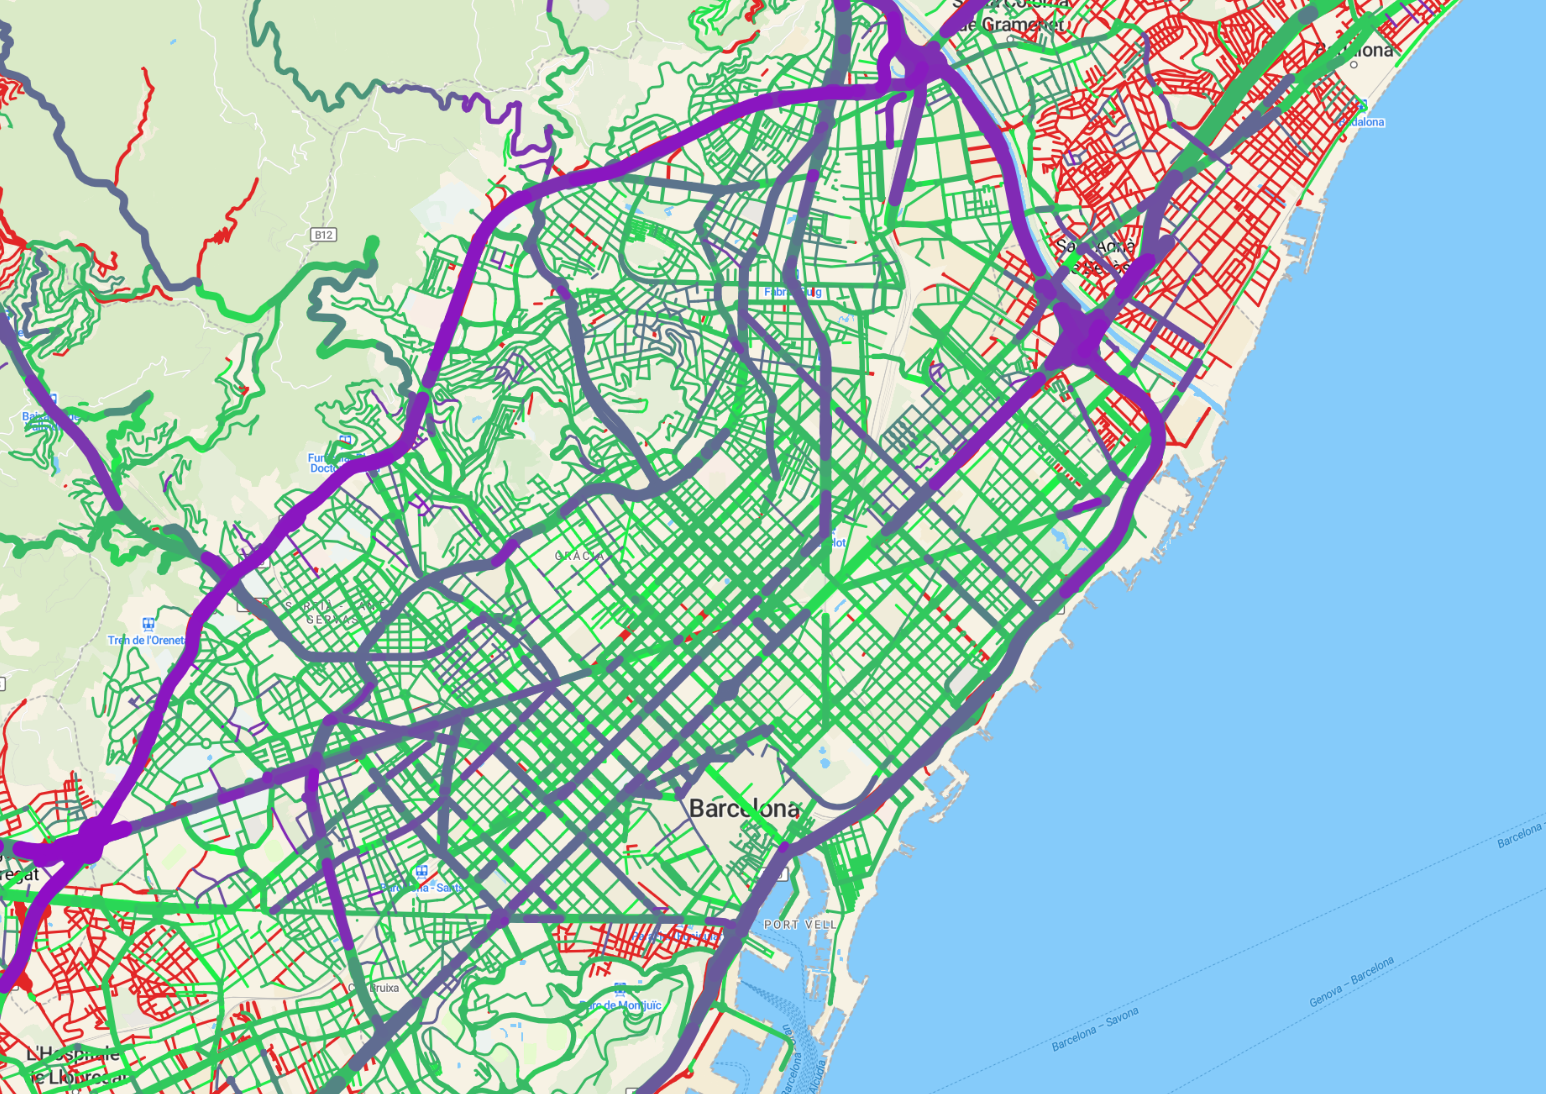
Barcelona – almost perfect. Reality start creeping in only after leaving city gates
How Useful Is It?
At this point, I’m not entirely sure how people will use this tool—whether as a QA tool or for route planning for next street-level capture. What I do know is that updating the map is time-consuming and could potentially cost me money (although I doubt it’ll turn into the next Facebook! 😄).
I would like to collect feedback from people who find this useful – why was it useful for you, how you plan to use it, how often you need refresh, what I need to change/improve… Please reach out if you would like this tool to live on.
Further ideas
I really, really don’t know how to do web development. This web site is horrendous, it doesn’t work on mobile, for start. I would like to add more details (“about” section with some background…). I would like to have better legend (as soon as I figure out how to align stuff in HTML… which will probably be never😄). I would like to better point out to users that this is not about values of maxspeed, but their freshness…
It would be good if you can click on highway and it give you OSM link to it, as well as current value.
One thing I am really pissed of is that tippecanoe cannot drop features by ordering of some attribute. To explain what I need – at lower zooms, there is lot of features to show and tippecanoe need to drop some of them. Tippecanoe can drop features by geometry, but not by ordering. I want to display motorways first, then trunks, and so on, and if there is space left in tile – to include other roads. I could exclude residential highways on zooms 0-5 (and join later with tile-join, it is possible), but if there is part of world where there would be a space to include them in tile, well – you are out of luck. And I didn’t want to give users impression that only major roads are on map when they first open map. On the other hand, tiles right now are filled with random highways, so there are visible gaps in major highways which really annoys me. If anyone has a solution, I’m all ears😄!
People were suggesting integration with Mapillary to conflate where captures are present and where Mapillary detected maxspeed signs, but I think this is going too much for time I can dedicate to this😀 (although I agree it would be interesting).
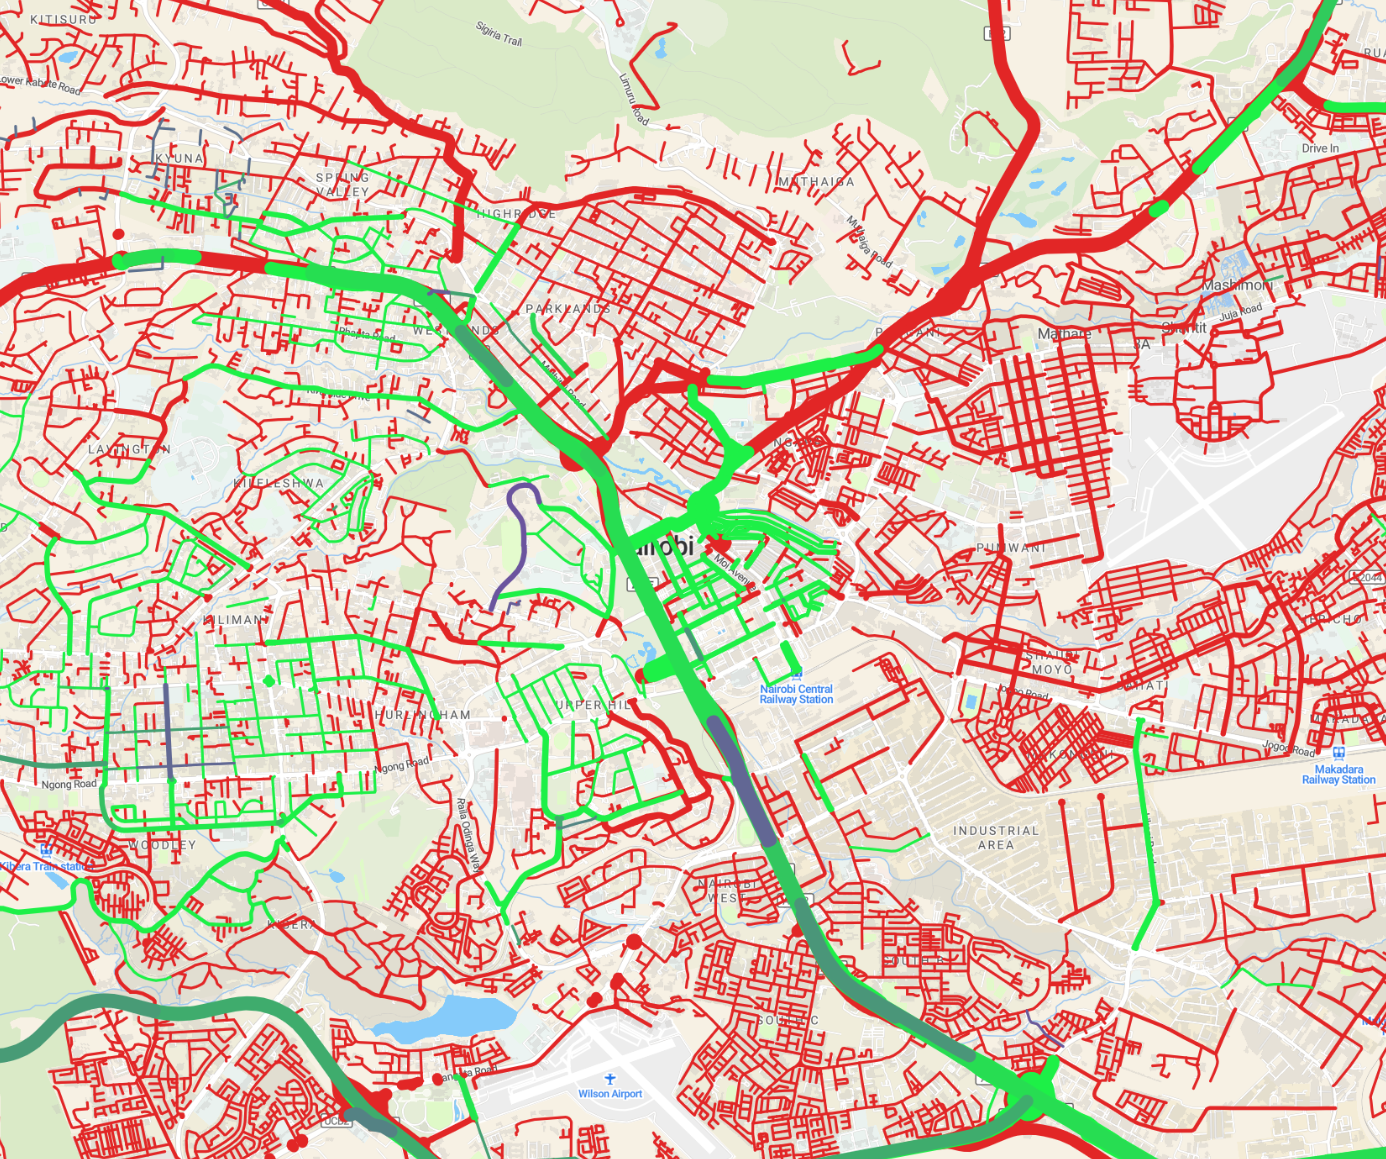 Home of latest SotM – Nairobi. Heaven for people with GoPro MAX😄
Implementation details
The entire codebase is available on Gitlab. It’s automated but takes a long time to process—generating a 20GB .mbtiles file for the whole world takes 2-3 days on my (not-so-cheap) machine! For the website, I’m using MapTiler as a basemap because I wanted a clean, neutral look instead of the usual OpenStreetMap.org style (and because I didn’t want to be another person pointing to openstreetmap.org tile servers).
On the technical side, this project taught me a lot about processing massive datasets on a single machine (300GB!). My most exciting discovery was learning LMDB.
Discussion
Comment from tallcoleman on 14 September 2024 at 05:46
This is very cool, thank you for making it!
Comment from Marcos Dione on 14 September 2024 at 11:39
Yes indeed. I just wonder if it wouldn’t be cheaper to import the data into a PG+PostGIS db, update it daily, and serve the tiles directly from there? I’m pretty sure that the last part exists… like this:
https://www.crunchydata.com/blog/dynamic-vector-tiles-from-postgis
Comment from Branko Kokanovic on 14 September 2024 at 14:29
Thank you both! I am not sure is it cheaper as I don’t know that setup (it is on my TODO list to do something that would involve calling ST_AsMVT:D). Without knowing details, I doubt that PG database consumes less RAM than my poor VM that chug along with 1GB of RAM usage of maptiler docker image, Maybe it could, if indeces are used and it can fit in this small VM, but seems that .mbtiles is far more specialized than PG+PostGIS for this specific task.
Comment from amapanda ᚛ᚐᚋᚐᚅᚇᚐ᚜ 🏳️⚧️ on 15 September 2024 at 09:31
Me too!
That would really help me with WaterwayMap.org. I opened a feature request (#132). Perhaps you can leave a comment on that issue to show how useful this feature would be. 🙂
Comment from Branko Kokanovic on 15 September 2024 at 10:37
I was looking at existing issues (“no way I am first one looking for this”), but apparently I skipped your suggestion:) Added some clarifying comment there, thanks for pointer
Comment from Marcos Dione on 15 September 2024 at 12:14
Yeah, no, 1GiB of ram wouldn’t allow you to even import the data, and the disk space is also astronomic: 360GiB for the whole Europe, although in my case it’s all data, while in your case it would be only part of the road network.
Comment from westnordost on 27 September 2024 at 11:19
Saw this through weeklyOSM. It looks really good and really useful! I also thought about including a similar thing in StreetComplete, in the overlays, but didn’t find a good solution for the use case that ideally one wants to see color-coded both the age and what it is currently tagged with (to find mistakes in the first place). In the end, I filed this idea in #4735 with the prevailing idea to just have slider setting that allows coloring as red if the information is older than X.
Maybe the code could be generalized so that one could easily do the same for other properties?
I don’t know if it is, but the color palette also looks like it would be (red-green) color blind-proof. Regarding the color palette, I am missing a legend that is telling me which color signifies what.
Red is probably “it’s missing”. Did you take into account that oftentimes when
source:maxspeed(or any of its siblings likemaxspeed:type) is specified, oftenmaxspeedis deliberately missing because it is an implicit speed limit (without signs)? If you don’t know it yet, you could also check out my talk Inferring Default Speed Limits from the State of the Map 2022. There’s alsomaxspeed:forward,backwardetc., but that tag is kind of rare.Also, what if
maxspeedwas tagged 10 years ago and the tag never changed, butcheck_date:maxspeed(or any of its sibling tags that are synonymous) specifies a newer date? Do you take this into account? It isn’t used a whole lot yet, but IMO it would be a good idea to use it more.Comment from westnordost on 27 September 2024 at 11:47
Oh, I just noticed that the legend pops up as a dialog at the very start, my bad!
I think years of training of clicking through cookie banners, “subscribe our newsletter” and “login with Google” dialogs finally paid off that I don’t even perceive startup dialogs anymore 😆
Comment from Branko Kokanovic on 27 September 2024 at 21:36
Hi, thanks for comment! I wanted to put legend somewhere convenient (lower-right corner), but I am just not good with html:/ So, popup it was:)
Regarding
source:maxspeed(I looked at your video), my interpretation of both source:maxspeed wiki and maxspeed:type wiki is that they just specify how value is obtained/set, not actual value itself. My thinking was that, due to this fact, consumers still rely on actualmaxspeedvalue and lack of it should be error. My simple overpass query shows 2000 ways in Germany withsource:maxspeedbut notmaxspeed, which seems more like statistical error (compared to number of roads). On the other hand, you are second person to ask about this, so I might be wrong about it:) I am open to be convinced:oRegarding colors, these just looked nice to me - red to represent missing and gradient from green to purple (but not red, so it is not wrongly mixed with missing values!) to represent vintage. I agree it is not friendly for color-blind people, I have to think about it more. I am still thinking if gradient is a good idea and that it instead should be couple of distinct steps. Something like upper-right corner here, per year. Nobody cares if it 1y3mon or 1y6mon. That being said, I think StreetComplete would also not benefit from gradient, better to keep it in ranges of 3 colors (missing, recent enough, not recent enough), where user defines threshold with slider that you mentioned. Or just 2 colors (red for both too old/above threshold and for missing). One thing to note is that this map does historical analysis of roads to get actual time when maxspeed is added, not check:date (but I guess you are aware of that). I don’t think StreetComplete have resources (your time, compute, …) to work with historical data (nor I am sure you should), but since you are now maplibre based (IIUC), I am open if you want to offer data from this map to StreetComplete in some (overlay) format? Updates would definitively not be minutely, more probably weekly/monthly, but we can discuss if you want to entertain this idea at all.