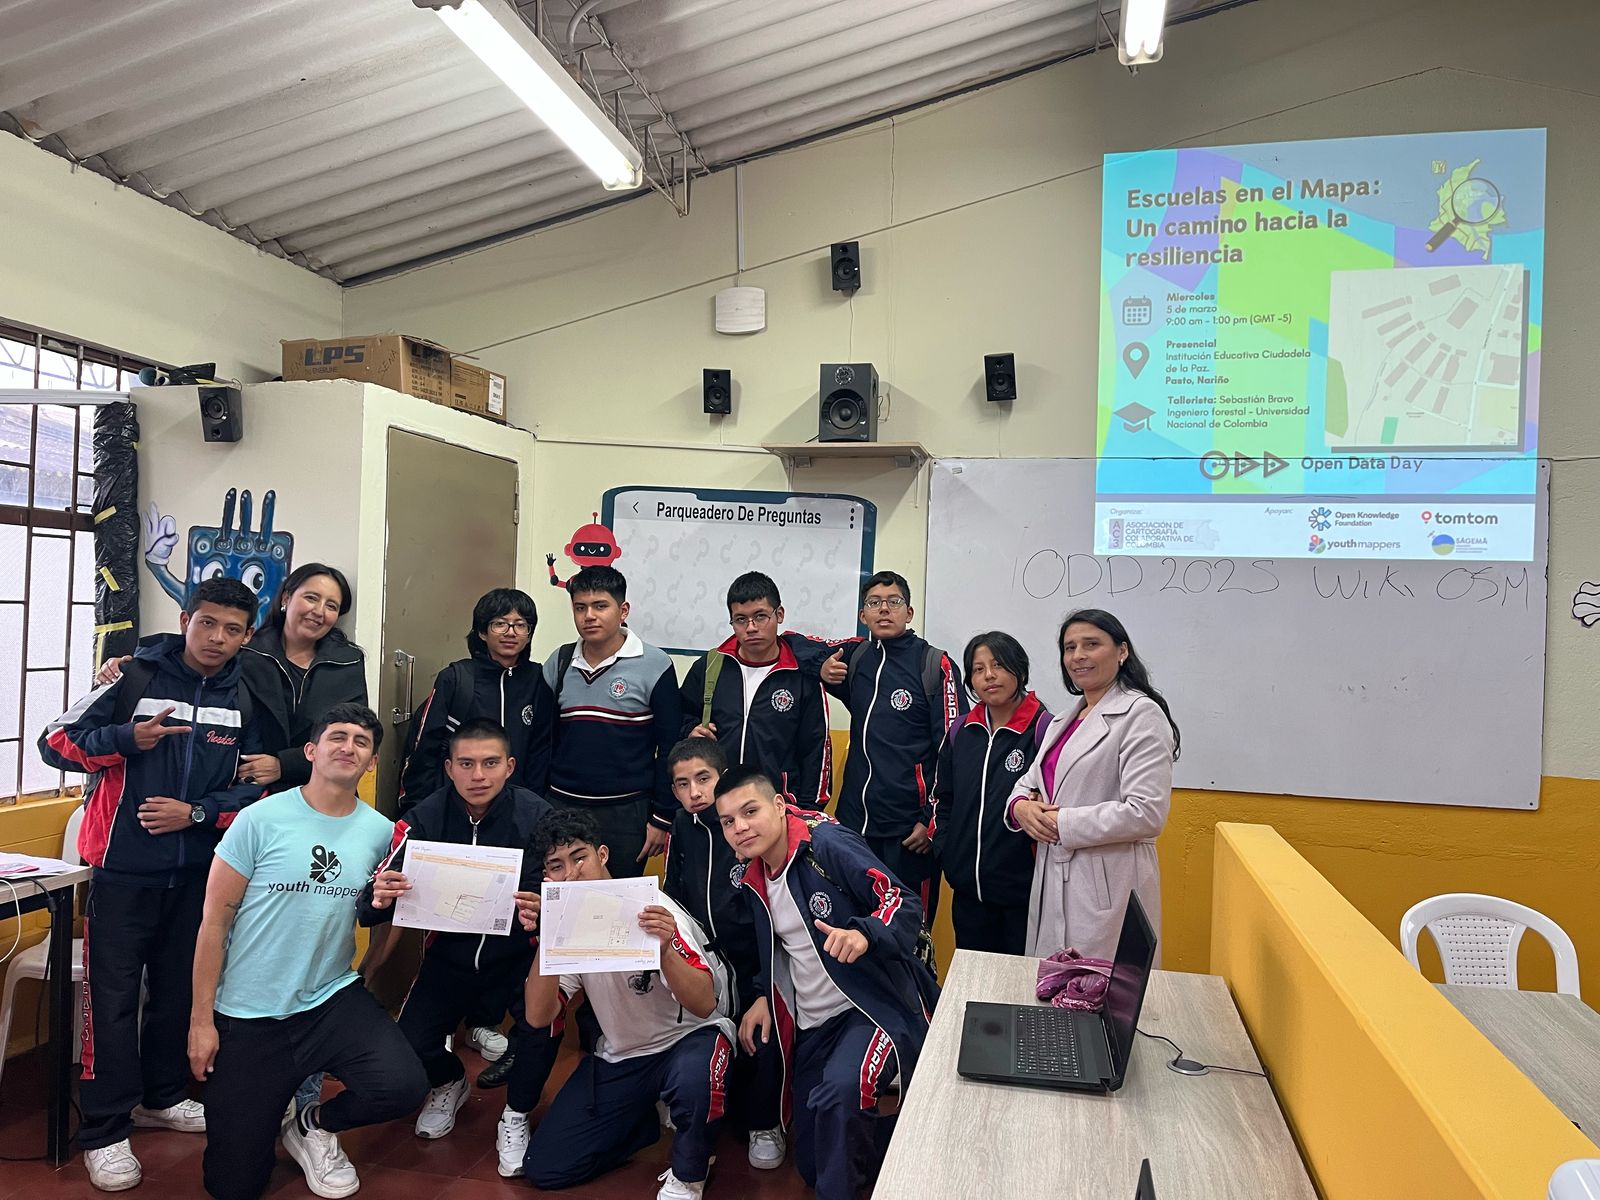
En un mundo donde la tecnología y la información geoespacial juegan un papel fundamental en el desarrollo de comunidades y territorios, estudiantes y docentes de la Institución Educativa Ciudad de Ipiales tuvieron la oportunidad de sumergirse en el fascinante universo de la georreferenciación. Gracias a la colaboración del instructor Sebastián Bravo, los participantes exploraron herramientas innovadoras como OpenStreetMap y Mapillary, descubriendo su potencial para la cartografía digital y la representación de datos geográficos.

Users' Diaries
Recent diary entries
Picked another town nearby. Patterson NY. Added most of the buildings in the area. Now need to work on the lots and land cover.
Before:

I must be mad as I have started two proposals in a day.
- Deprecate socket:tesla supercharger and socket:tesla destination
- Rules for marking some Mailing Lists as archived
I have also started a conversation (and am looking for proposals) on bicycle charging tagging.
I welcome all your comments on them.
97390 addresses completed
A few minor changes, so this is more an update, but with close to full details.
The tools;
- Forward looking 8.3MP/4K dashcam 2FPS.
- Left facing (270 degrees) old Samsung 8MP phone 1FPS. (Out passenger window)
- Left rear facing (225 degs) old Samsung 3.6MP phone 0.6FPS. (Out passenger window)
- The dashcam records audio (my voice) in one minute chunks.
- All photos and audio are geo-referenced to their current location.
- The Garmin navigation GPS has a current OSM based (mkgmap) map, a POI set of OSM FixMe’s.
- I am a permanent road dweller, retired and wandering Australia. For 10 years now.
The methods - Start of day;
- Start a GPS/NMEA (USB via laptop) UBLOX recording function that also flags movement >3kph and <40kph.
- Start an APRS beacon for those that like to track me. (msg me for details)
- Mount/power up the side facing phones and launch their (laptop) 3>40kph recording scripts.
- Power up the dashcam and let its own GPS settle for 2-3 mins. This is also the voice notes recording device.
The methods - Basic drive;
- Open high speed road 70*100kph. Just let it capture doing voice as below.
- Can’t really play music as it can trigger voice events.
The methods - Voiced items;
This is a backlog of before and afters. I went up the road a little bit to another town with not too much mapped. Mapped the buildings in the immediate town center and a bit of the green. I need to continue mapping the greens near the town center to fill it out a bit more.
Link to the map area Middletown Springs VT
Before

After
Hier startet die Schweden-Resoe 2025
Picked another small town name in Vermont. There wasnt too much to map here. Dont have details on the ground.
Before:

and After:
Open Data Day 2025
Desde la Asociación de Cartografía Colaborativa de Colombia - AC3 , lideramos uno de los eventos del Open Data Day (ODD) 2025 en Colombia. La temática de esta año fue “Policrisis”. La policrisis se puede etender como la ocurrencia de múltiples sucesos simultáneos que afectan a la sociedad, y donde abordarlos de manera individual es, en cierta medida, inútil, debido a sus correlaciones e interdependencias (ver artículo).
Nuestra propuesta
Nuestra apuesta para combatir la policrisis se basó principalmente en dos (2) elementos:
-
El fortalecimiento de las capacidades en STEM y TIC de los niños, niñas y jóvenes, prepaŕandoles para el futuro (y el presente).
-
El mapeo adecuado de Sedes Educativas como herramienta para la respuesta a crisis humanitarias.
El Open Data Day 2025 en El Carmen de Viboral, Antioquia, Colombia
En varias ciudades de Colombia se realizaron eventos en el marco del ODD 2025. Dentro de estas, estuvo El Carmen de Vibora, Antioquia, Colombia, donde realizamos una actividad con los estudiantes del pregrado en Desarrollo Territorial de la Universidad de Antioquia.
La mayoría de los y las estudiantes no conocían OpenStreetMap (OSM), o por lo menos no con nombre propio.
Iniciamos la jornada del 04 de marzo de 2025 haciendo una breve introducción a qué es OSM, cómo se pueden usar los datos, y cómo hacer ediciones a través del iD Editor.
I am a visually impaired user of Open Street Map, and I already contributed some places to the city of Simi Valley and a few surrounding areas. I think it would be nice to create a Navilens tag for Open Street Map. I don’t mean an actual Navilens QR code, just a tag saying that there is navilens available at a particular place. This is just a sort of true-or-false or yes/no tag. Navilens is a service that allows visually impaired people to navigate using special QR codes detected by a celphone from several meters away without the camera pointing to the code. Now if the Navilens tag gets implemented into OSM, Navilens themselves could contribute directly to Open Street Map for places that have Navilens codes, especially bus stops. We could also contribute to Open Street Map if we know for sure that a place has Navilens. That way, visually impaired people around the world know what places they can use the Navilens app for navigating.
Contexte :
- Le gestionnaire du réseau de transport de gaz en France GRTgaz, a changé de nom le 30 janvier dernier https://www.natrangroupe.com/medias/communiques-de-presse/grtgaz-devient-natran Ce changement de nom a nécessité une migration des objets contenus dans la base OpenStreetMap mais cela permet aussi de faire un état des lieux du réseau gazier français dans notre base de données.
Les données existantes :
- Comme pour le réseau électrique, le réseau gazier a commencé à être intégré dans OpenStreetMap il y a plus de dix ans, avec comme sources l’imagerie Bing ou le Cadastre pour identifier les stations de compression, les stockages souterrains de gaz et les artères principales du réseau.
- Il y a environ 7 ans lors de la mise à disposition du tracé des réseaux en OpenData et l’amélioration d’année en année de la qualité des vues aériennes, la cartographie s’est intensifiée permettant d’affiner le tracé du réseau, d’ajouter les tronçons de conduites manquantes, d’identifier les bornes jaunes dans le paysage ou encore d’ajouter les sous-stations gaz de distribution.
- Les différentes propositions réalisées pour ajouter, modifier ou déprécier des tags sur les réseaux transportant des fluides (Proposition pour décrire les vannes ou la proposition pour améliorer la cartographie des bornes) ont permis de faire un « entretien » régulier et d’enrichir les données de façon continue.
- Du fait que le sujet des réseaux gazier est moins connu par la communauté OpenStreetMap que d’autres sujets comme les réseaux électriques, les contributeurs ont parfois utilisés des tags assez génériques ou peu adaptés pour décrire les installations.
Exemples de tags utilisés pour décrire les sous-stations gaz :
As an OpenStreetMap contributor, I always pay attention to how maps are used in media and various software applications. It is fascinating to see OSM data appear in unexpected places. Previously, I noticed that OpenStreetMap was used in the movie Mission: Impossible.
Recently, I came across an example of OSM’s osmCarto style being used in the software of the Skyranger 35, a highly mobile air defense system.

Open Data Day 2025: Mapeando el Futuro de la Educación en Casanare
Hoy celebramos el evento Open Data Day 2025 en la Universidad Internacional del Trópico Americano (Unitrópico), junto a mis compañeros del capítulo de YouthMappers en el área de cartografía. Bajo la dirección de la ingeniera Doris Ruiz, nos centramos en el uso de herramientas como OpenStreetMap para llevar a cabo actividades de mapeo colaborativo, contribuyendo a hacer frente a la policrisis que enfrenta nuestra sociedad.
Nuestro objetivo principal fue mapear la infraestructura de las instituciones educativas en el departamento de Casanare. Este mapeo incluyó no solo los edificios, caminos y vías, sino también áreas naturales como jardines, árboles, prados y otros elementos. A través de OpenStreetMap, pudimos identificar múltiples áreas y elementos, empleando técnicas de fotointerpretación con las imágenes de **BING y ESRI disponibles en la aplicación.
Open Data Day 2025 en Colombia
En Colombia, por segundo año consecutivo, se celebró el Open Data Day, esta vez en su edición 2025. Seis ciudades participaron en el evento: Pasto, El Carmen de Viboral, Ipiales, Yopal, Pore y, por supuesto, Villavicencio, Meta.
En esta ocasión, el 6 de marzo de 2025, se llevó a cabo una jornada de mapeo junto con estudiantes de la Universidad de los Llanos (Unillanos), para muchos de los cuales era su primera experiencia en este tipo de actividad.

Objetivo del mapeo
Este año, el objetivo del mapeo fue identificar y registrar puntos de interés en instituciones educativas, permitiendo a los estudiantes comprender el papel fundamental que juegan las escuelas y centros educativos en contextos de crisis humanitarias, desplazamientos forzados y desastres naturales. Históricamente, estas instituciones han servido como refugios temporales para las víctimas, brindando apoyo mientras se encuentran soluciones para su retorno a sus territorios.
prince of university
Cette entrée a pour but de répondre à une question posée sur le forum, mais rédigée pour donner plus une vue d’ensemble de l’activité qu’une simple description des méthodes.
Appréciant particulièrement la micro-cartographie, les cheminements des piétons ont naturellement fait partie de mes préoccupation depuis presque les débuts de ma contribution. Mais la tâche était immense (surtout pour une agglomération de la taille de celle où je résidais alors) et je ne passe pas tant de temps que ça dehors avec un ordiphone à la main…
Groupe local et évolutions techniques
Mais depuis, plusieurs choses ont évolué.
J’ai découvert StreetComplete, qui contient plusieurs quêtes sur les trottoirs et passages piétons (en particulier l’accessibilité de la bordure entre l’un et l’autre). Plusieurs utilisateurs au sein du groupe local angevin utilisent StreetComplete — notamment Sébastien Chopin, qui sillonne littéralement l’agglomération.
En particulier, ces utilisateurs qualifiaient le filaire là où il existait déjà et ne pas avoir cette possibilité partout en fonction des filaires créés ou non était dommage.
D’autre part, la qualité des orthophotographies disponibles s’est nettement améliorée, les trottoirs et passages piétons étant généralement parfaitement visibles.
Et enfin, le groupe angevin est plutôt intéressé dans l’ensemble aux questions d’accessibilité. Sébastien Chopin — toujours lui — entreprend même des démarches d’acquisition de matériel spécifique.
Débroussailler
Dans ce contexte, la cartographie à grande échelle des cheminements piétons est redevenue un de mes sujets d’intérêt.
J’ai donc commencé à planifier une modification d’envergure sur la commune d’Angers pour ajouter autant de filaires de trottoirs et de passages piétons que possible à partir des imageries disponibles.
Whenever I use files containing OSM data, I’m faced with two major
problems. These problems are inherent in the OSM data model and
inherited by the common file formats (.osm, .o5m, .pbf).
The first of these problems is about accessing the data: As a result of the data model users are forced to use either huge amounts of memory or a lot of time. Often even both.
The second problem is even worse: Quite often you have to guess properties of the data, which means using heuristics. But by their very nature, they can lead to wrong results. The most prominent example is probably the question, if a closed way element represents a linear object or an area.
To overcome these problems I invented a new file format. The main idea: Convert the data once (accepting the drawbacks caused by the two problems) and end up with data that can be processed fast, using only little memory. I also tried to keep the file size small and the file format simple.
I called the new format “OMA format” like “Open MAp”. It’s accompanied by a human readable version called “OPA format” like “Open PAper”. (Oma and Opa are the German words for grandma and grandpa).
It took me about a year to design the Oma file format, and write a converter and a library for querying the new file format. I still consider it in experimental state, as I would like to get some feedback before releasing a stable version. Hence this post.
All this is a lot of stuff and I can’t go into all the details in just one blog post. For this reason I’ve decided to keep this article brief and base it on a single example. In the coming weeks, I will be writing more articles about the new file format, which will provide more in-depth information.
Scattered Data in OSM Files: The Viktorstraße in Wuppertal
My personal enemy that I take so serious, is someone who edits an area on a map as “under construction” and then it SITS for longer than 6 months in that stage. In some cases people have been living in that neighborhood for 3 years…and it’s been marked as “under construction.” Here I am today fixing areas that are fully developed now, fully established- and the average of the construction edits were made 2 years ago. Here’s hoping doordash, my personal use favorite Strava, or even pokemon go run an update for those poor folks.
This is purely a diary rant about residential areas and their roads not being updated. I almost wish there was a way to make “under construction” just be something for an existing thing being updated/fixed, not something being built. We’re mapping what’s there to be mapped. I’d rather new developments or roads have like a “coming soon” tag of some sorts that wouldn’t block in app access.
We can use strava as an example, i’ll set a route and it’ll make me avoid an entire neighborhood because “Deleted User” 3 years ago marked these 7 streets near the lake trail as “under construction.” Took me a sad amount of time, admittedly, to realize what was happening. Another example is Niantic not having in game spawns (pikmin, pokemon, ingress) if an area is marked “under construction” because the game labels the area as dangerous, so why would they give server room to RNG spawn their in game items there? Reality though is Ash can and SHOULD be able to catch his Pikachu there because he’s been living there for 3 years- Niantic just doesn’t think it’s safe.
So, here’s my little rant about the amount if neighborhoods i fixed today that i have personally been to, biked through, walked my dog through, that have been “under construction” the last 28 months.
I finally got back to mapping, after about 6 months of being inactive. I’m really happy!
Hoy desarrollamos nuestro evento Open Data Day 2025: Escuelas en el mapa, un camino a la resiliencia en la Institución Educativa Ciudadela de La Paz, en Pasto, Nariño. Por segundo año consecutivo, desde el capítulo YouthMappers SAGEMA, apoyamos el diseño metodológico de la participación de la comunidad OSM Colombia en el Open Data Day, esta vez con un enfoque en el uso de datos abiertos en entornos educativos.

Junto a los estudiantes de grado 9, recorrimos la institución utilizando Mapillary, demostrando su importancia como herramienta para capturar imágenes inmersivas y mejorar la visibilidad de la infraestructura escolar. También empleamos Field Papers para mapear la distribución de espacios clave como baños, laboratorios, oficinas, salones, caminos, el restaurante escolar y la tienda.